Sell in May, Not Today- May 2023 Newsletter
Earnings Season
We’re ~90% through US Q1/23 earnings season. S&P 500 companies have recorded their best performance relative to analyst expectations since Q4/21, with both the number of companies reporting positive EPS surprises and the magnitude of these earnings surprises above their 10-year averages.
For the full year 2023, S&P 500 earnings growth remains marginally positive (+1.2%), though we would not be surprised to see the index record a margin EPS loss for the full year.
As we outlined in our quarterly webinar, we believe the market can look through a negative full-year print. However, if we avoid a negative earnings year, inflation continues to cool, and the Fed remains on hold, this could provide a further catalyst for the market to post strong gains.
Bottom line, earnings are a significant contributor to stock market returns, and the past quarter is providing evidence corporate America is in relatively good shape.
Sell in May, Not Today
We rely daily on simple rules to navigate the world around us. Heuristics are mental shortcuts commonly used to simplify problems and avoid cognitive overload.
While spending the time to thoughtfully consider all the possible scenarios may produce a more optimal outcome, a mental shortcut often arrives at a satisfactory solution.
If it's cloudy outside, we bring an umbrella. However, if we had opened the weather app, we would have learned it would be a beautifully sunny day during the hours we planned to be outside.
In finance, mental shortcuts are rules of thumb which provide simple solutions to complex problems. "Sell in May and go away" is one such classic example. This theory postulates that investors should exit the market between May and October while staying fully invested from November to April.
The November to April period indeed produces superior returns. Since 1981, 69% of the time, November to April returns exceed that of May to October. The average return was 7.0% versus 2.2%, respectively.
But for the sell-in-May theory to outperform a buy-and-hold strategy, one must invest the cash proceeds for six months at an annualized yield of approximately 4.5%. In the good old days, when cash offered a competitive return, this strategy may have made sense (more on this later).
S&P 500 Return Profile – Sell in May
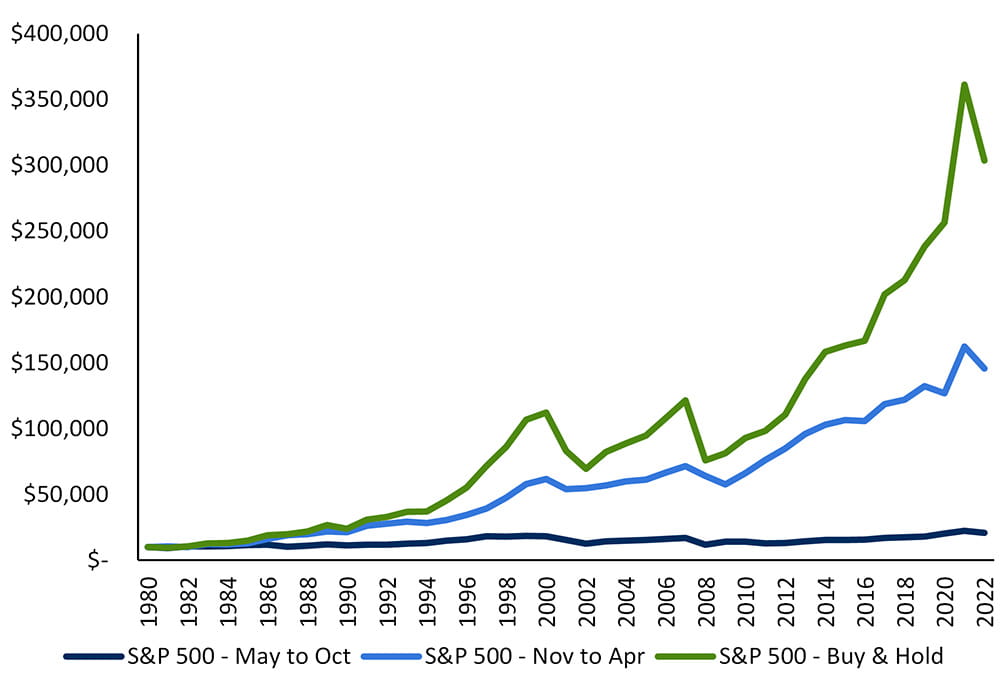
Source: Factset, Raymond James
As with any rule of thumb, it is worth revisiting occasionally. Over the past decade, the sell-in-May rule has been even less effective. The average May to October return has increased to 4.9% (10.1% annualized), thus creating an increased drag on performance for those following the shortcut and exiting the market.
A possible explanation for the improved May to October return profile over the past decade may have been the lack of alternatives to stocks (remember TINA; there is no alternative). While bonds and cash offered capital protection over the past decade, they provided little in return; today, that has changed. It will be interesting to revisit this rule of thumb to see if the May to October return reverts toward its historical average.
S&P 500 Return Profile – Sell in May over the Last Decade
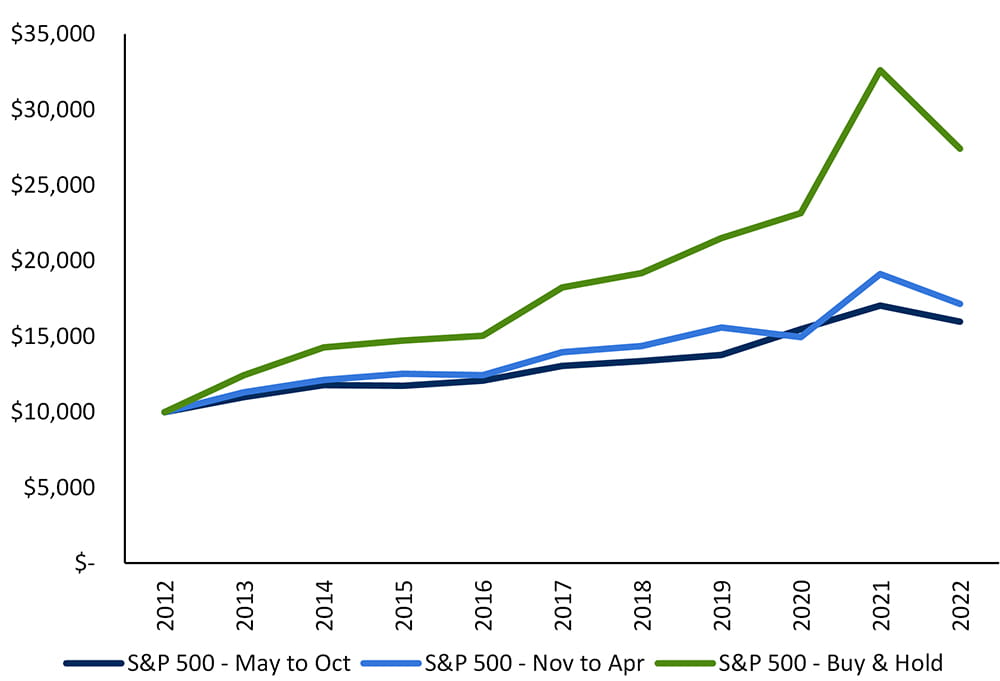
Source: Factset, Raymond James
Time for a Pause
Perhaps the paradigm shift away from "There is an Alternative" (TINA) will change the future dynamic of sell in May, at least for now, there is a good reason to stick around for the next several months.
May could very well be the Federal Reserve's (Fed) last rate hike. Tighter financial conditions are doing much of the Fed's heavy lifting. US Treasury Secretary (and former Fed head), Janet Yellen, reiterated this point,
"Banks are likely to become somewhat more cautious in this environment…we already saw some tightening of lending standards in the banking system prior to that episode, and there may be some more to come."
The more restrictive lending conditions "could be a substitute for further interest rate hikes that the Fed needs to make."
The point is that we are nearing the end of the hiking cycle. Bottom line is that once the Fed is done, markets tend to produce good returns.
The chart below illustrates S&P 500 returns leading up to, and 12 months after, a Fed pause. Over the last six cycles, the average market return 12 months after the Fed stops hiking interest rates is 16.1% (see Charts of Interest for a further breakdown of market performance after a pause).
The only exception was in 2000 when the market continued to correct from a period of "irrational exuberance" that drove Dot-com stocks to superficial high valuations.
S&P 500 Performance Around Fed Pause
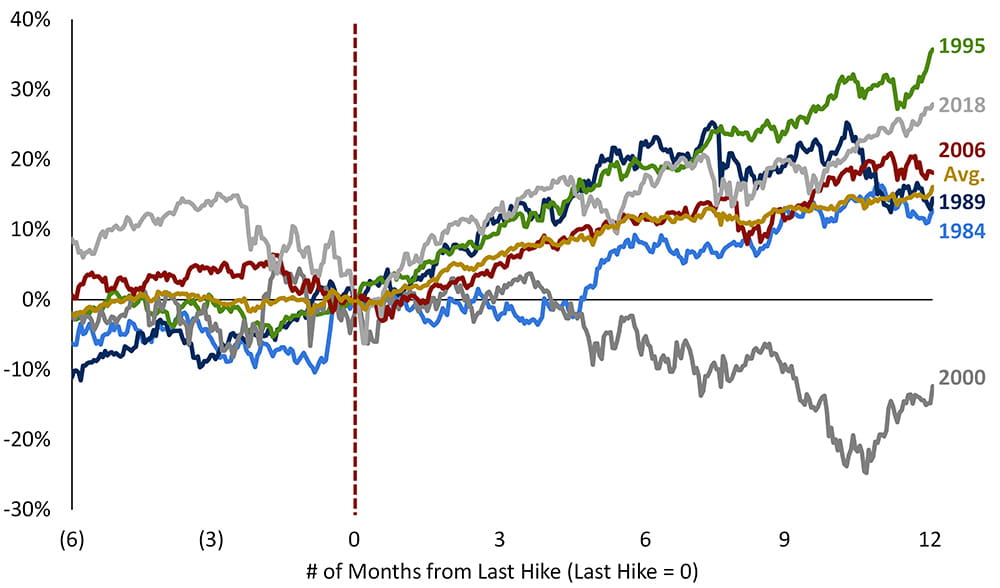
Source: Factset, Raymond James
That Ain't No Bull
Investor sentiment, while improved since last year, remains pessimistic and investor positioning defensive. According to the BofA Global Investment Manager Survey, investors are overweight bonds and cash at the expense of equities.
Simply put, there are plenty of new investors that can come into the market and support further gains. We just need a good reason to support this rotation.
This catalyst could be any of the following: a Fed pause, a better outlook for corporate earnings, easing inflationary pressures and/or economic resiliency that delay the onset of a recession.
Or perhaps it's FOMO (the fear of missing out). The S&P 500 could very well have entered a new bull market.
As illustrated below, during the last two bear markets (2008/2009 and 2020), the S&P 500 never recorded a positive quarter, let alone two consecutive positive quarters. Only after the market exited the bear market did we see positive quarterly returns, and similar to 2008/2009, the last quarter marked back-to-back positive gains.
We will only know in hindsight if we've entered a new bull market, but based on recent history, the worst may very well be behind us, and the bear market may have ended last October.
Beginning of a New Bull Market?
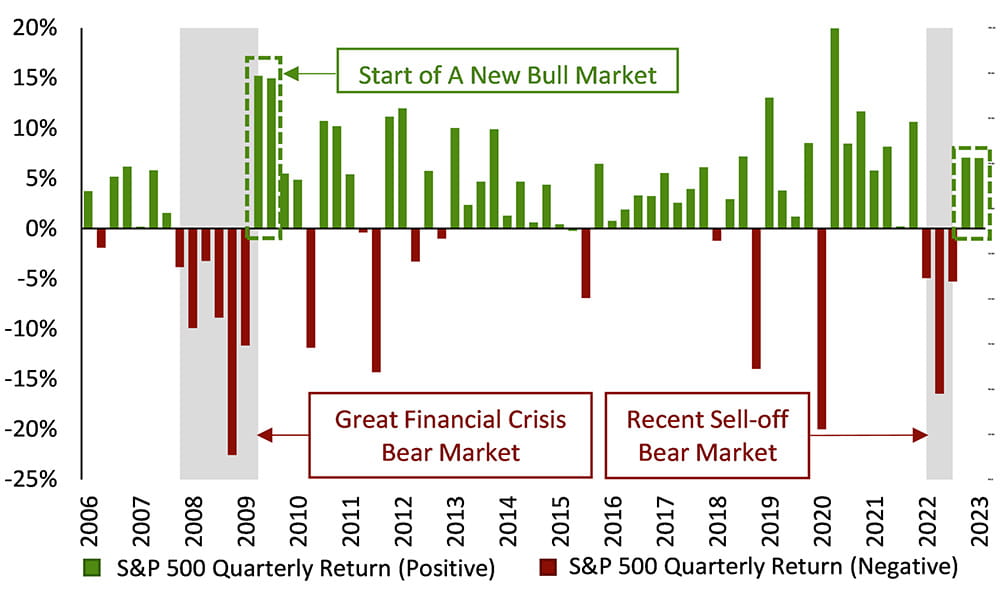
Source: Factset, Raymond James
Bottom Line
The sell-in-May rule of thumb has become less useful over the past decade, but the mental shortcut will be interesting to revisit in the coming years as there is now an alternative to stocks. Regardless, a buy-and-hold strategy far exceeds any attempt at timing the market.
The Cadence approach that tactically maneuvers throughout business cycles demonstrates an ability to mitigate downside volatility while achieving the long-term benefits of staying invested.
As for additional reasons to stay in May, the market is predicting a Fed pause in the coming months. Historically, markets have produced solid returns for stocks 12 months after a pause. Given investor sentiment, any positive catalysts may provide additional buying demand for stocks and confirm the nascent bull market.
Charts of Interest
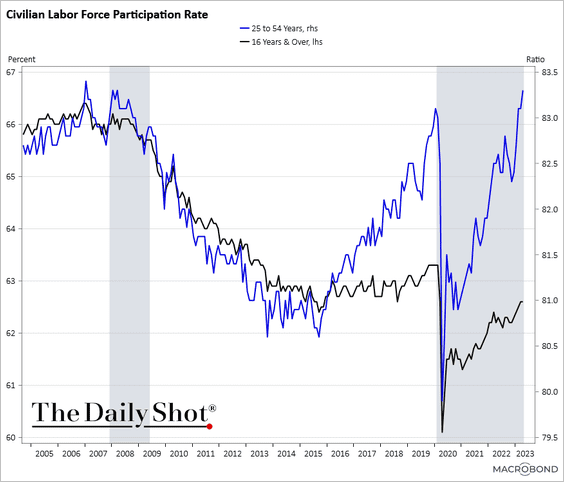
Wage inflation (and shelter) has been the thorn in the Fed’s side as it attempts to cool inflation. However, prime-age labour force participation has been surging, which in theory, should slow wage growth in the coming months.
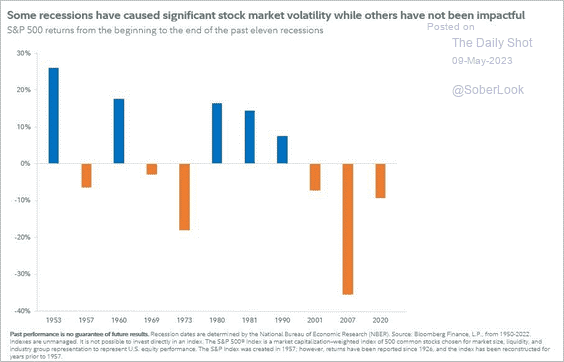
Not all recessions are the same. Of the last 11, five ended with stocks higher than when the recession began.
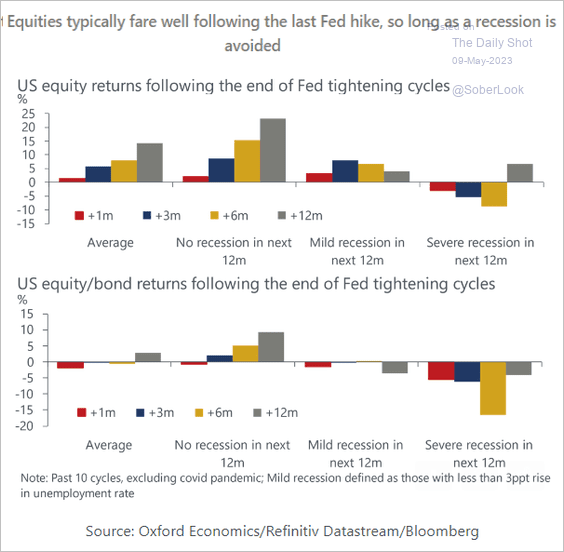
How do stocks perform after the Fed’s last hike under various scenarios. If we avoid a hard landing, stocks can continue to build on year today gains.
Website legal disclaimers
Raymond James Ltd. is an indirect wholly-owned subsidiary of Raymond James Financial, Inc.
Securities-related products and services are offered through Raymond James Ltd., member Canadian Investor Protection Fund.
Insurance products and services are offered through Raymond James Financial Planning Ltd, which is not a member Canadian Investor Protection Fund.
Raymond James Trust Services are offered by Raymond James Trust (Canada) in the provinces of British Columbia, Alberta, Saskatchewan, and Ontario, and by Raymond James Trust (Québec) Ltd. in the province of Québec. Both entities are wholly owned subsidiaries of Raymond James Ltd. Trust Services are not covered by the Canadian Investor Protection Fund. Use of the Raymond James Ltd. website is governed by the Web Use Agreement | Client Concerns.
Raymond James (USA) Ltd. All rights reserved.
Raymond James (USA) Ltd. advisors may only conduct business with residents of the states and/or jurisdictions in which they are properly registered. Investors outside the United States are subject to securities and tax regulations within their applicable jurisdictions that are not addressed on this website.
Raymond James (USA) Ltd. is a member of FINRA/SIPC.
![]()
This website may provide links to other internet sites for convenience of users. Raymond James (USA) Ltd. is not responsible for the availability of content of these websites, nor does the firm endorse, warrant or guarantee the products, services, or information described or offered by these other internet sites. Users cannot assume that these websites will abide by the same Privacy Policy that Raymond James (USA) Ltd. adheres to.
© 2024 Raymond James Ltd. All rights reserved. Member IIROC / CIPF | Privacy Policy | Web Use Agreement
